Quantelor QN24 Results
This page centralizes validation figures and forward observations so the main website stays readable. Historical backtests and demo-account observations are deliberately kept separate.
Global backtest: 02 Jan 2024 → 20 Aug 2026
Initial capital: €10,000. Historical validation kept separate from forward observations.
Additional metrics
Gross profit: 83,490.41
Gross loss: -60,058.74
Max balance drawdown: 7.49%
Recovery Factor: 9.71
Sharpe: 19.25
Trade distribution
Winning trades: 342
Losing trades: 601
Win rate is not interpreted in isolation; it must be read together with Profit Factor, drawdown and the gain/loss relationship.
Three separate tests
| Period | Net profit | Profit Factor | Equity DD | Trades |
|---|---|---|---|---|
| 2024 | +€6,663.56 | 1.50 | 9.03% | 346 |
| 2025 | +€5,026.26 | 1.33 | 7.18% | 361 |
| 2026 through Aug 20 | +€3,307.08 | 1.40 | 7.35% | 235 |
One GER40 event observed across three demo environments
This is the same SELL signal, not three independent trades.
10:10 → 10:19:44
10:10 → 10:19:38
10:10 → 10:19:38
3 environments
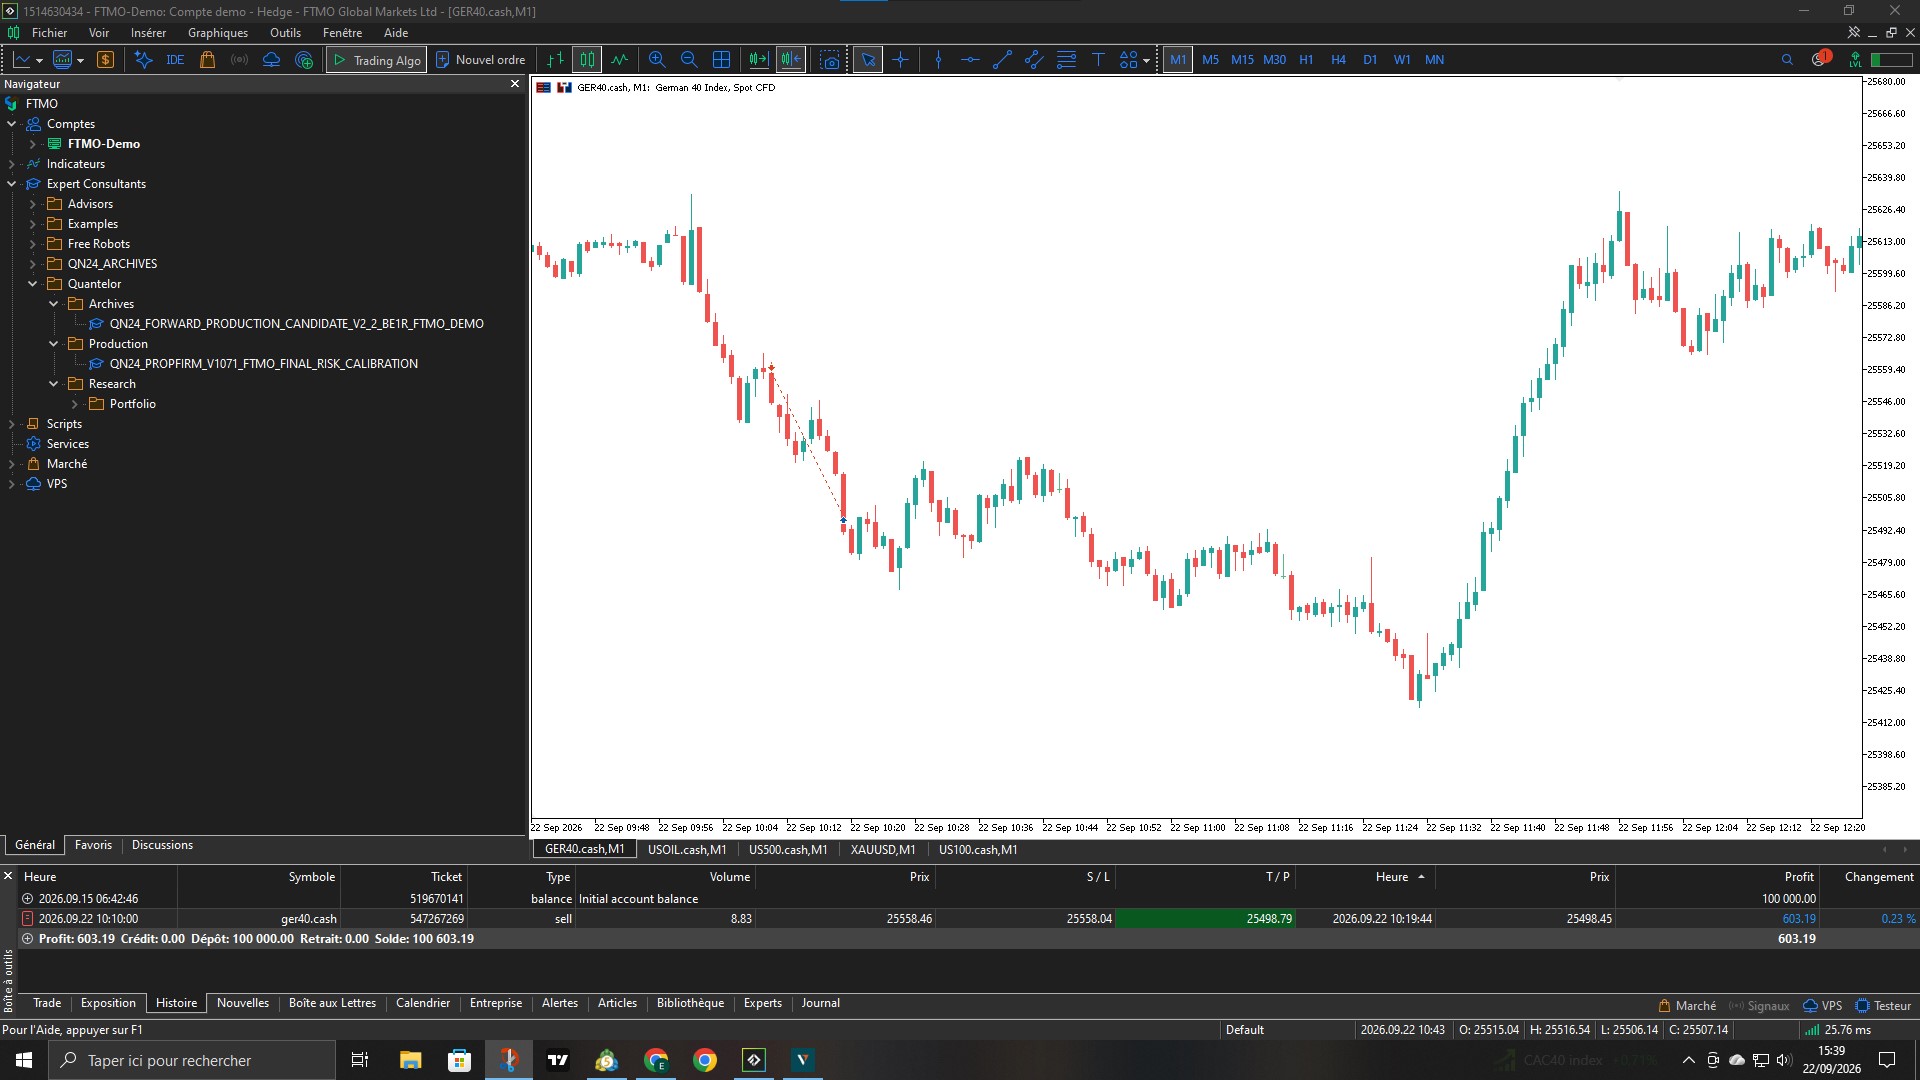
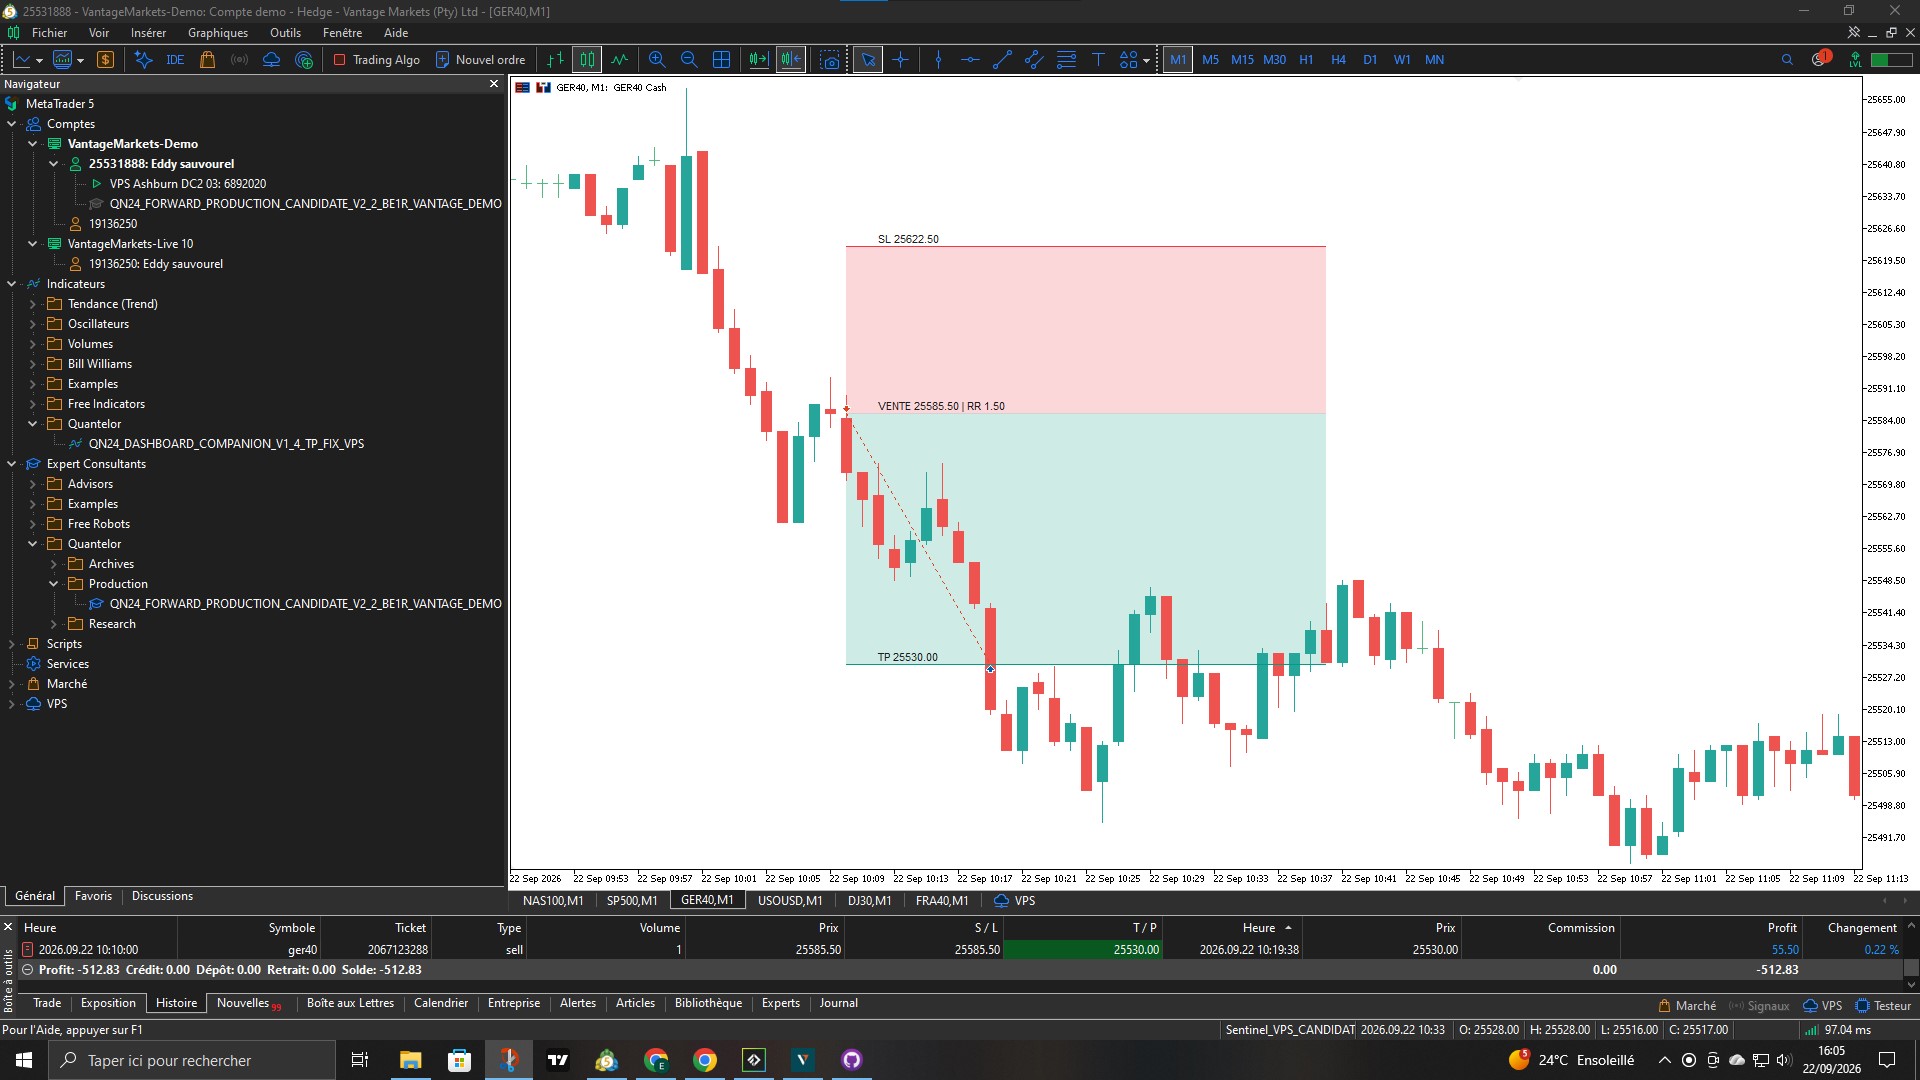
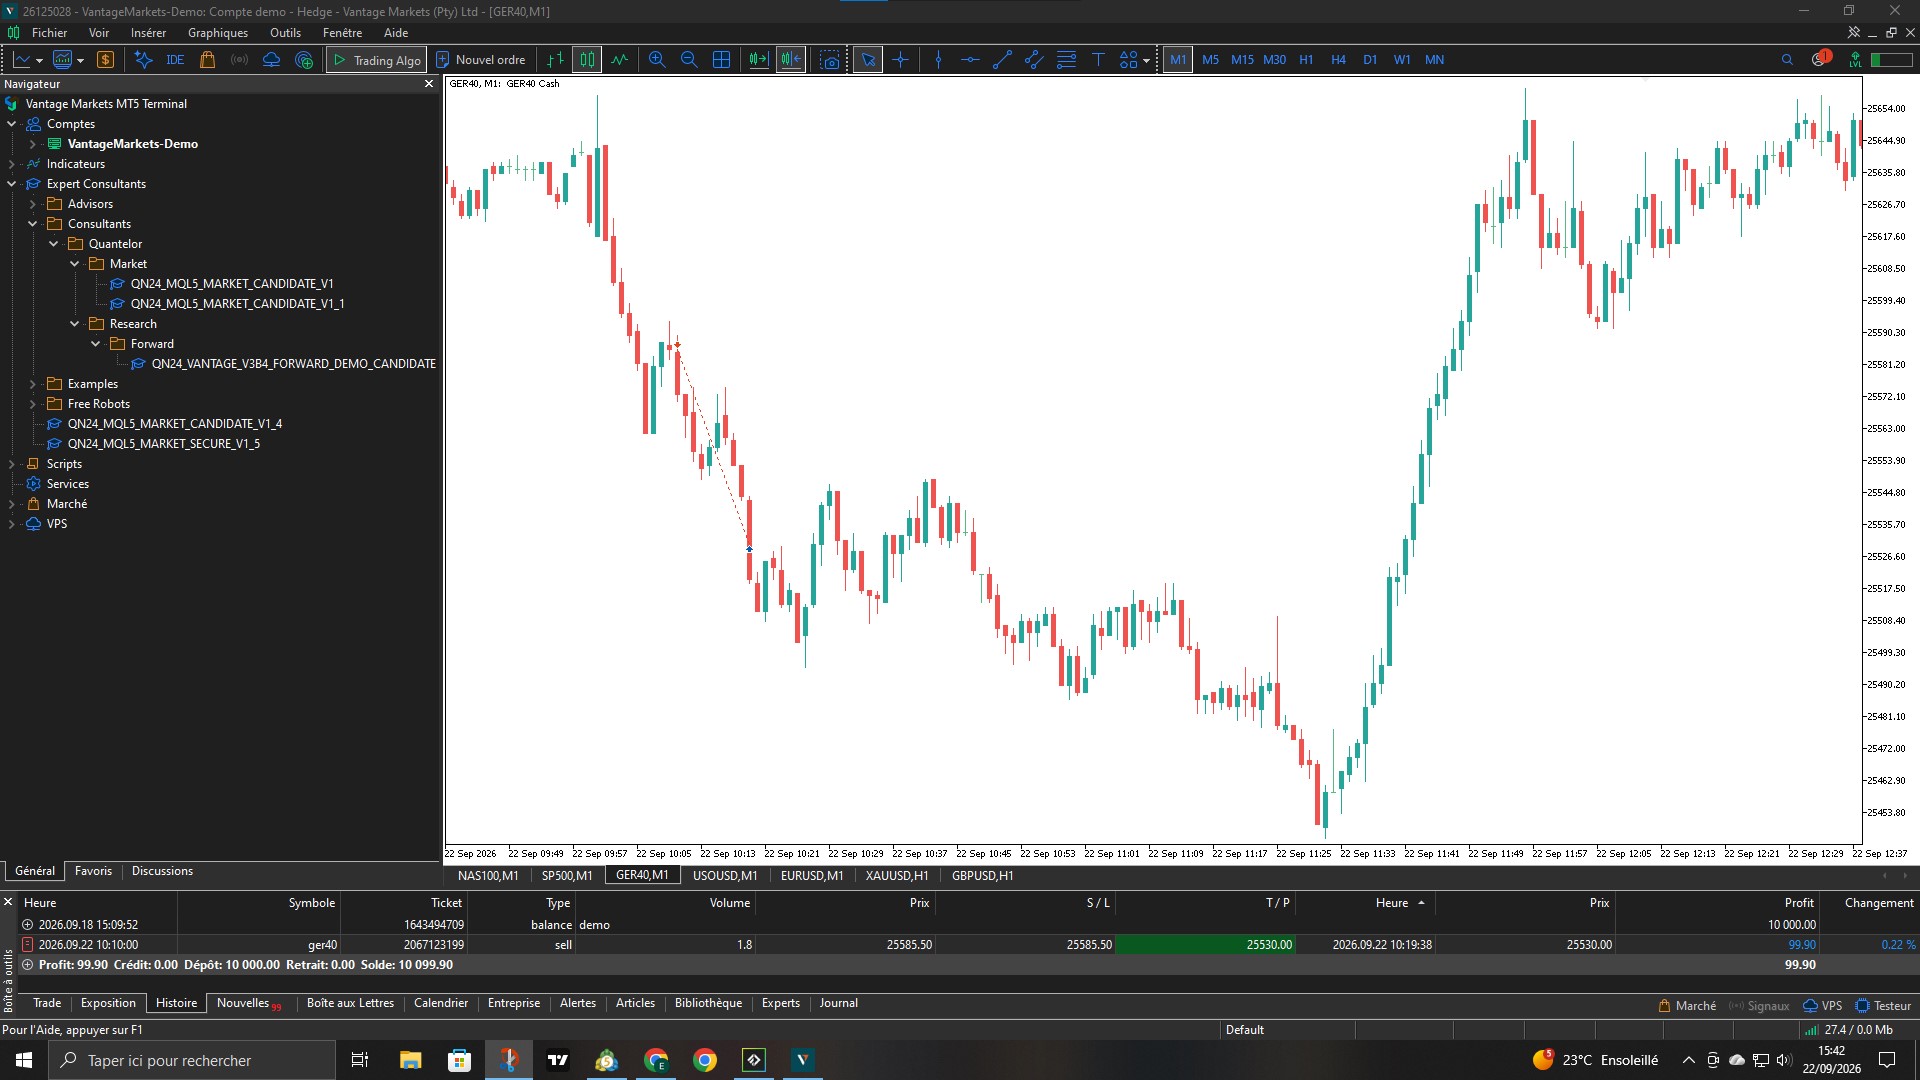
GER40, NAS100 and SP500 — cross-environment comparison
Three market events were observed on FTMO Demo, Vantage 1888 and Vantage 5028. The Vantage 5028 account visibly ran the V1.6_DIAG variant and is therefore kept separate from the final Market build.
GER40 — SELL
| Environment | Volume | Entry | Exit time | Result |
|---|---|---|---|---|
| FTMO Demo | 13.31 | 25,418.66 | 10:29:47 | -418.18 |
| Vantage 1888 | 1.4 | 25,440.00 | 10:29:44 | -35.70 |
| Vantage 5028 DIAG | 2.6 | 25,440.00 | 10:29:44 | -66.30 |
Near-simultaneous exits; event classified as consistent and to be monitored.
NAS100 / US100 — BUY
| Environment | Volume | Entry | Exit time | Result |
|---|---|---|---|---|
| FTMO Demo | 9.02 | 30,573.78 | 17:01:37 | +1.35 |
| Vantage 1888 | 0.9 | 30,618.19 | 17:01:08 | -0.03 |
| Vantage 5028 DIAG | 1.8 | 30,612.44 | 17:01:11 | -0.01 |
Break-even behaviour visible across all three environments.
SP500 / US500 — SELL
| Environment | Volume | Entry | Exit time | Result |
|---|---|---|---|---|
| FTMO Demo | 34.84 | 7,703.85 | 17:21:03 | -10.80 |
| Vantage 1888 | 3.6 | 7,710.95 | 17:21:14 | 0.00 |
| Vantage 5028 DIAG | 6.7 | 7,710.95 | 17:21:15 | 0.00 |
Exits near break-even with very close timing.
What is separate, stays separate.
Historical backtests
MetaTrader 5 simulations on historical data. They document how the model behaved in the tested historical period.
Forward / demo
Execution observations on demo accounts. They are used to check signal, sizing and execution consistency across environments.